Outside a client's comfort zone
Find the discussion on Linkedin or Bluesky.
Feb 12, 2025
This is part of a trilogy on the state of our industry:
Last spring, I worked with one of my favorite repeat clients to automate one of their internal reports. Without getting into too much detail (because NDAs lol), they wanted this high-visibility quarterly report to update and circulate more regularly. They didn’t have the bandwidth to do this manually because the process of arriving at those numbers was so laborious.
I proposed a back-end tool built with Observable Notebooks that would automate 90% of their process (all they had to do was upload their vendor data), and a corresponding webpage to chart the information for weekly distribution.
Over the course of a month, I designed, pitched, and implemented a report with three charts, one of which was a bespoke visualization. I had the buy-in of my main stakeholder, and—I thought—his team. A few weeks before my wedding, I handed off my 90% completed project to the team, and asked for them to stress test it in my absence so that I could fix any bugs or superficial visual and textual changes when I got back.
So imagine my surprise (shock, and frustration) when I came back from my wedding to an email from a member of the team declaring that the third visualization—the only custom, non-standard chart—was very confusing. They suggested re-designing it from scratch. A few minutes later, my key stakeholder (and decision maker) responded that because we only had a week left on our contract, we wouldn’t have time to redesign. Instead, he offered, we should just cut it out entirely.
—
For those of us who create charts for a living—and especially for those of us who enjoy discovering novel ways of communicating data—this is probably one of our biggest frustrations. We are always balancing clarity with the wow factor—the great visual appeal that can hook an audience. And in recent years, I’ve noticed a trend among clients, especially those that are communicating business metrics to internal stakeholders, to lean towards the traditional and well-trodden.
At first, I felt dismayed. This was one of my long-term clients that I had worked with on and off since 2018. They had never before flinched at an unorthodox design, so long as they were convinced that it communicated their data effectively. And certainly, I had never been asked for a whole redesign so close to the finish line. Where was this feedback when I first presented the idea in a sketch? Where was it when I showed it in various stages of implementation—always accompanied by a voiceover of how to read the visualization?
But after a few minutes, I was able to calm down and take a step back to recognize that a lot of my reaction was due to my ego. I got into this field because I love making bespoke designs tailored to a specific data set. I take pride in that. And while I shed the bad habit of my youth (novelty for the sake of novelty) long ago, it was still hard for me to come to terms with delivering a report containing only a bar chart and line chart.
Putting my bruised ego aside, I was able to admit to myself that my custom design was hard to read, particularly because I hadn’t yet provided a legend. I had assumed that because I had spent all those meetings explaining the visualization, that I could finish the legend when I got back from my wedding. I can recognize now that in the weeks of my absence, the team could have easily forgotten those two-minute explanations, and it must have been frustrating to read the custom visualization with no guidance.
That was my first valuable lesson: to provide the annotations of how to read the visualization starting at the very first design discussion. They don’t have to be high fidelity, and they don’t even need to be implemented in code. (As many of us who create web-based data visualizations know, it is surprisingly non-trivial to implement good legends and annotations in SVG, which is why I used to always leave them to last.) These days, I take a screenshot as soon as I get data on the screen, then I bring it into Illustrator (or sometimes even Google Slides) to annotate the design.
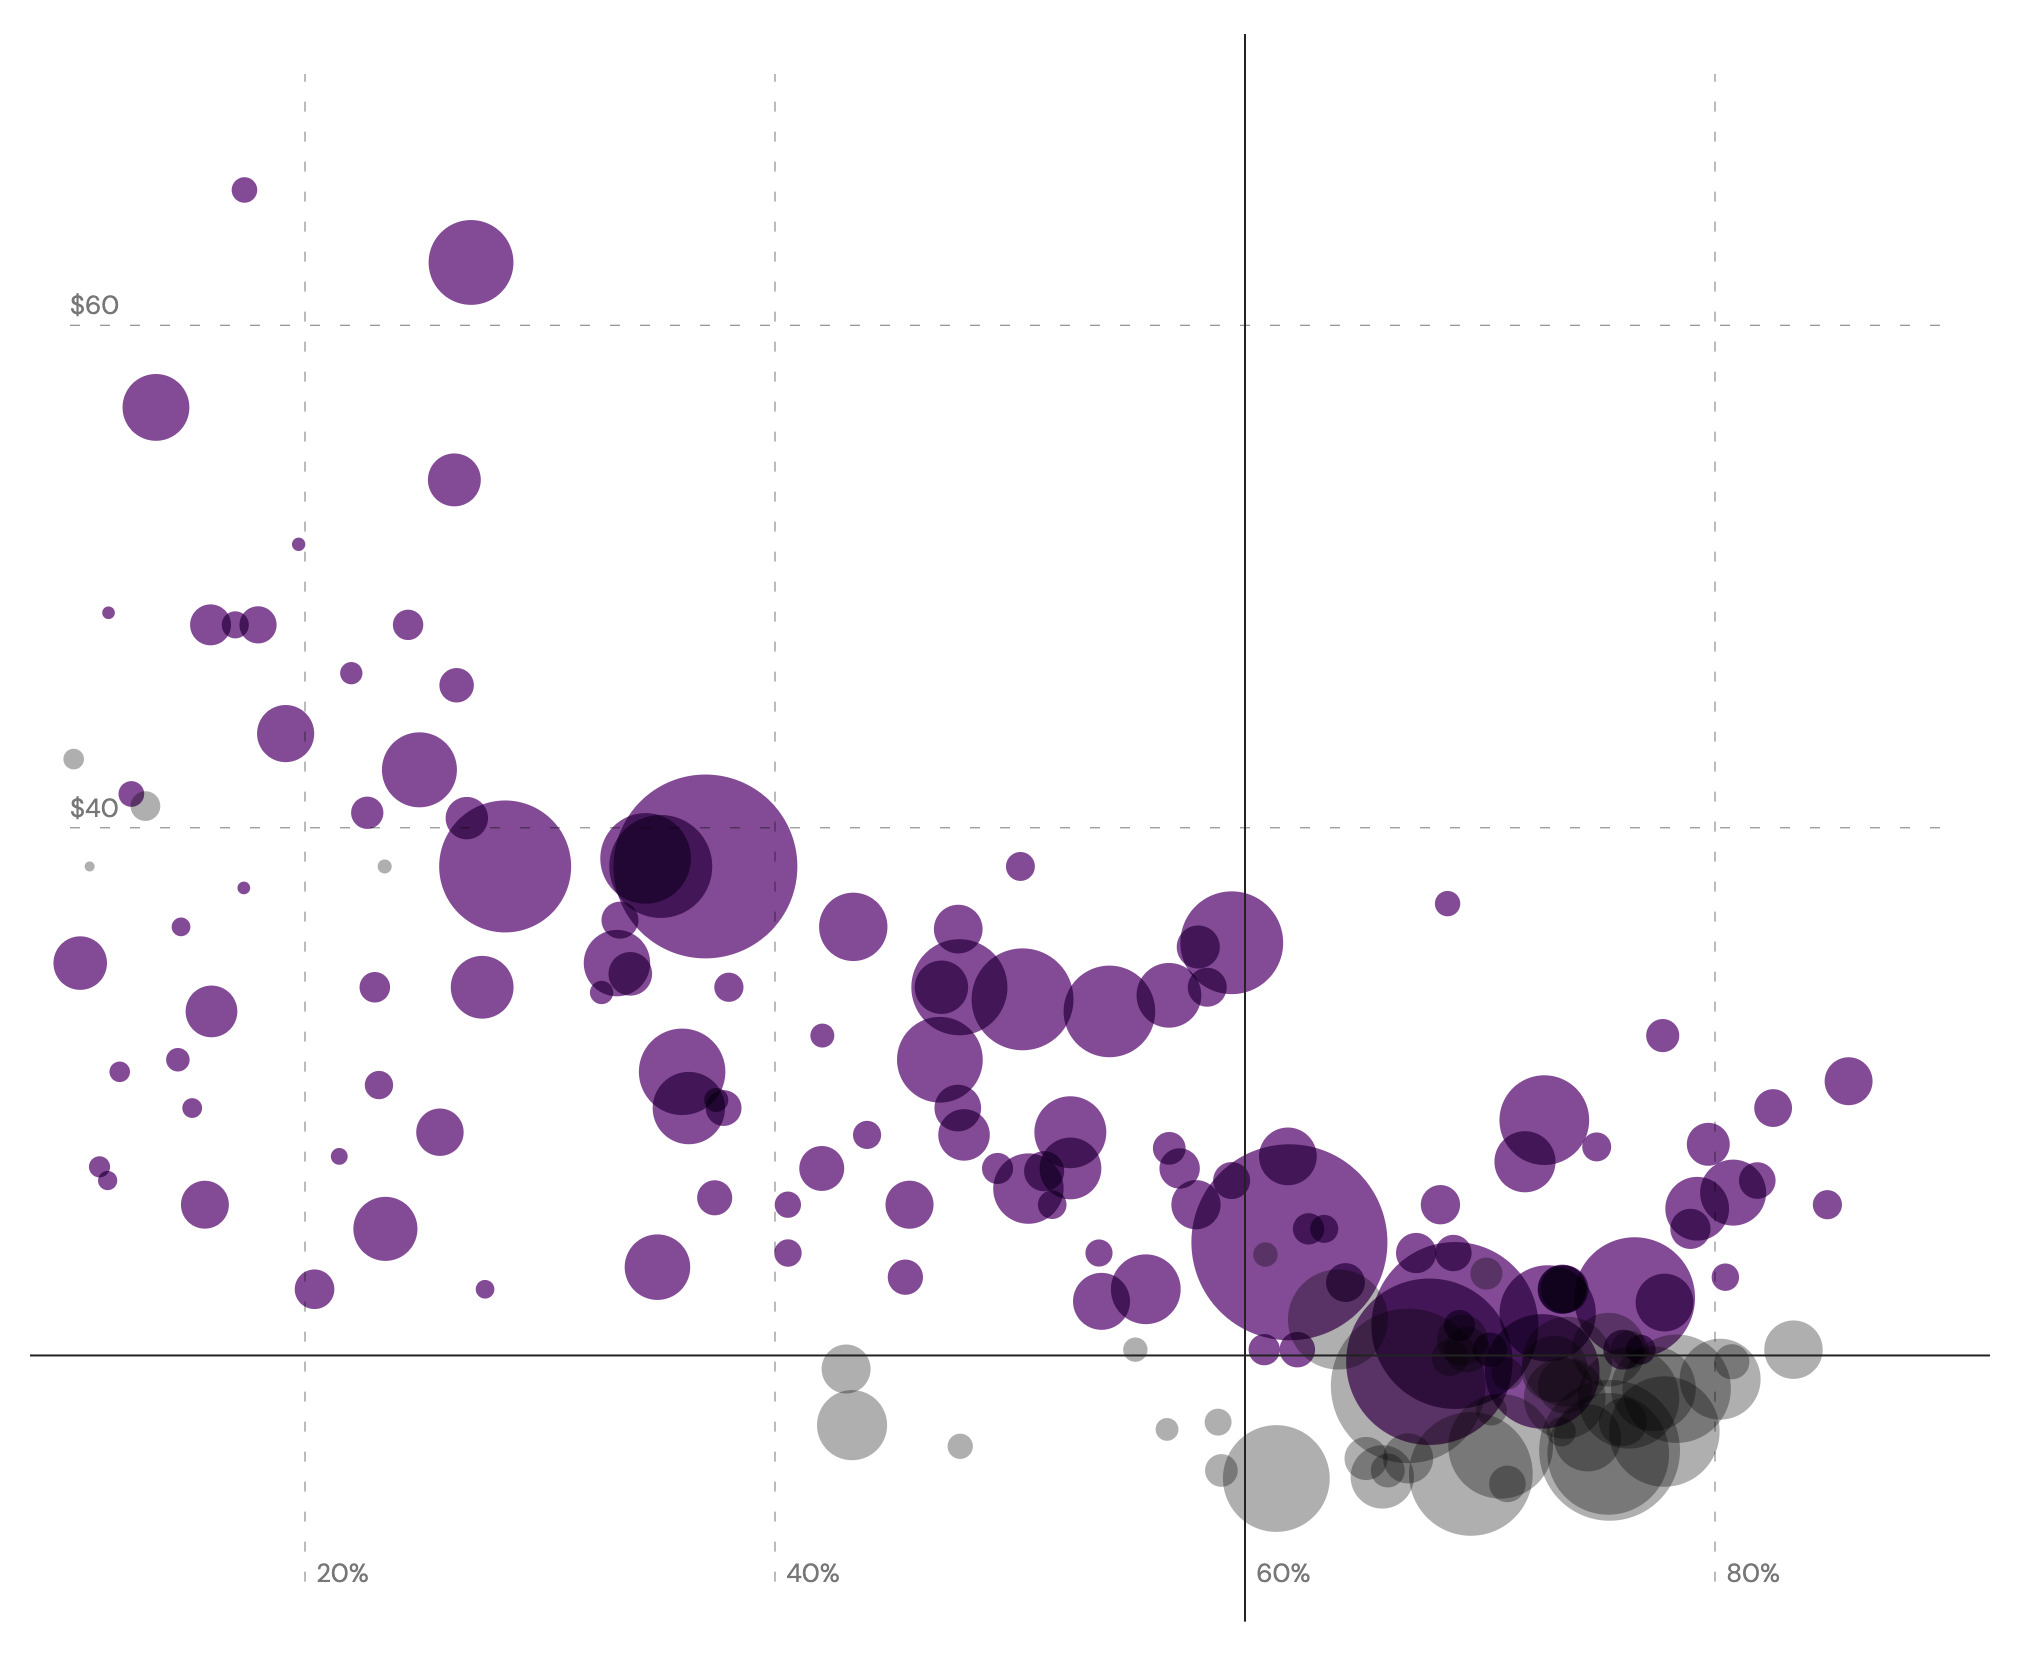
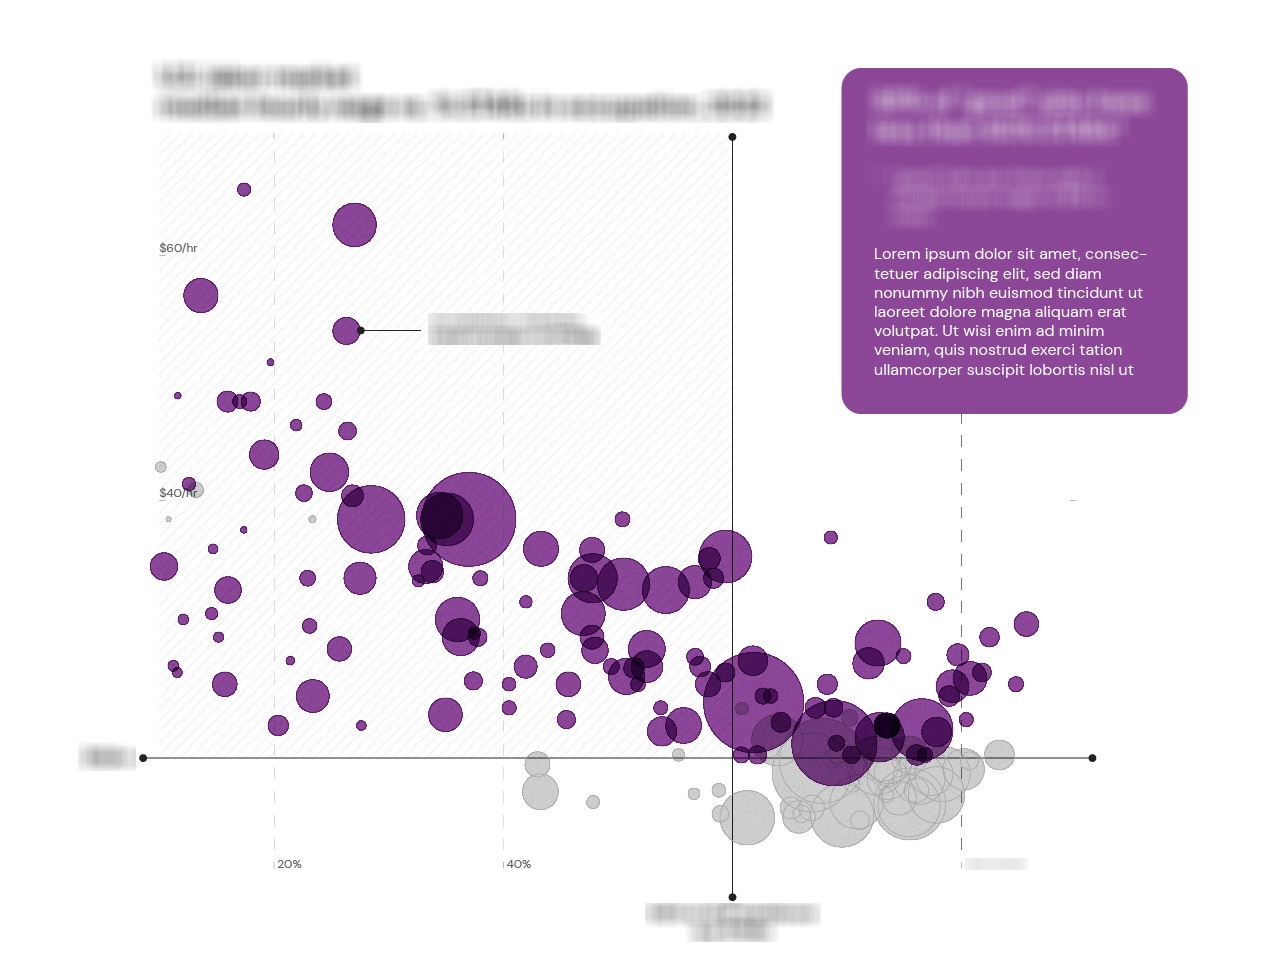
I code just the minimum to get data on the screen (circle and axes positions, axes labels) to pull into Illustrator, either as a screenshot or by copying the SVG in (left). I then add the annotations and little flourishes—arrow markers, patterened callouts—in Illustrator because I find the process to be so much faster than refining in code (right). I then share the results in a slide deck with my clients.
It might seem like extra work to annotate first in Illustrator, then again later in code, but I’ve found it actually saves time in client meetings since I no longer have to verbally explain how to read the visualizations. Because there’s no ambiguity on how to read the visualizations, I can get alignment from my clients early on, saving potential heartaches (like this exact story!) down the line. And as an added bonus, it’s much faster to code arrows and text placements after I’ve done the legwork of iterating them and refining them in Illustrator.
The second big realization I had (thanks to my husband’s insight!) was that oftentimes clients push back on new or obscure data visualization designs because they are wary that their stakeholders might resist having to learn how to read them. So I now try to design from a place of empathy, rather than ego, and consider how much time and energy my stakeholders have to spend socializing the visualization to their stakeholders. After all, I’m trying to make my clients’ lives easier, not add to their work.
Relatedly, and perhaps most importantly, I’ve come to realize that my value is being a thought partner who helps my clients figure out ways to communicate their data effectively. My value is not (as I had once thought in my early years) based on how original my designs are nor how well written my code is—though these things certainly help. And as their thought partner, my job is to help them negotiate the right balance between that clarity and wow factor: What are the supporting points of the story? For those, let’s go with (a visually beautiful) implementation of a familiar chart that readers can quickly onboard. That way, we can save the more bespoke visualizations for the main call to action, so that readers will want to spend the most time in that section, and really feel the weight and impact of it.
This negotiation goes even into the details of which data variables (out of sometimes dozens) make the cut. What is the bare minimum we’d need to include in order to effectively tell the story, and which are nice-to-have’s? What visual metaphors can we take advantage of to decrease the reader’s mental toll—and confusion—when they need to decipher a new visualization?
—
With these lessons in mind, I now kick-off each new client project by reading something along these lines to them:
The way that I interpret our work together is that I’m here to help create data stories with great visual appeal that do not sacrifice any data integrity. You already have a great data team that tells really clear stories. I believe it’s my job to push beyond those really clear, really functional charts to see if we can visualize this data in such a way that hooks people and inspires them to take action. The design phase is when I go really far out to try and test the limits of what’s possible, and then together we will dial it back in to find that sweet spot that works for your audience.
I do my best work when I get to collaborate with you, when we riff on ideas together—especially because I know you’ve been thinking about this for months. So please consider all the ideas I pitch in this design phase as options for us to have a conversation through, instead of the final proposal, and feel free to let me know when you’ve already considered the idea I’m pitching. It’ll help me get up to speed with the dataset and the story.
This has not only helped to set expectations, but has also invited my clients into my process as a collaborator, ensuring that if and when our visions don’t align, that we can realign very early in the design phase.
—
As for my client, it didn’t feel right to completely take out the information my custom visualization provided. So I decided to share a subset of the information as text, displayed in a simple four-column list. In my final hand-off, my client’s team exclaimed that they had never seen the information presented that way before, and that it was extremely insightful and valuable. 😂
In addition to cutting the custom data visualization, my stakeholder asked for a pie chart—so my final deliverables were the back-end tool for processing the data on a weekly basis (which, to be fair, was the main deliverable they were paying for anyways) and a report with a donut chart, line chart, and bar chart. 😂😂😂
But these days, I ain’t even mad.
